Turbocharger Compressor Stage CFD: MRF vs Sliding Mesh
1. Objective & Key Results
This project compares the steady Multiple Reference Frame (MRF) method with the unsteady sliding-mesh approach to evaluate accuracy versus computational cost in predicting compressor performance.
MRF: converged in ~1.7 hours; predicted a stable 2.13× pressure boost.
Sliding Mesh: required > 380 hours (> 2 weeks); captured periodic pressure fluctuations at the rotor frequency and blade-passing harmonics.
2. Geometry
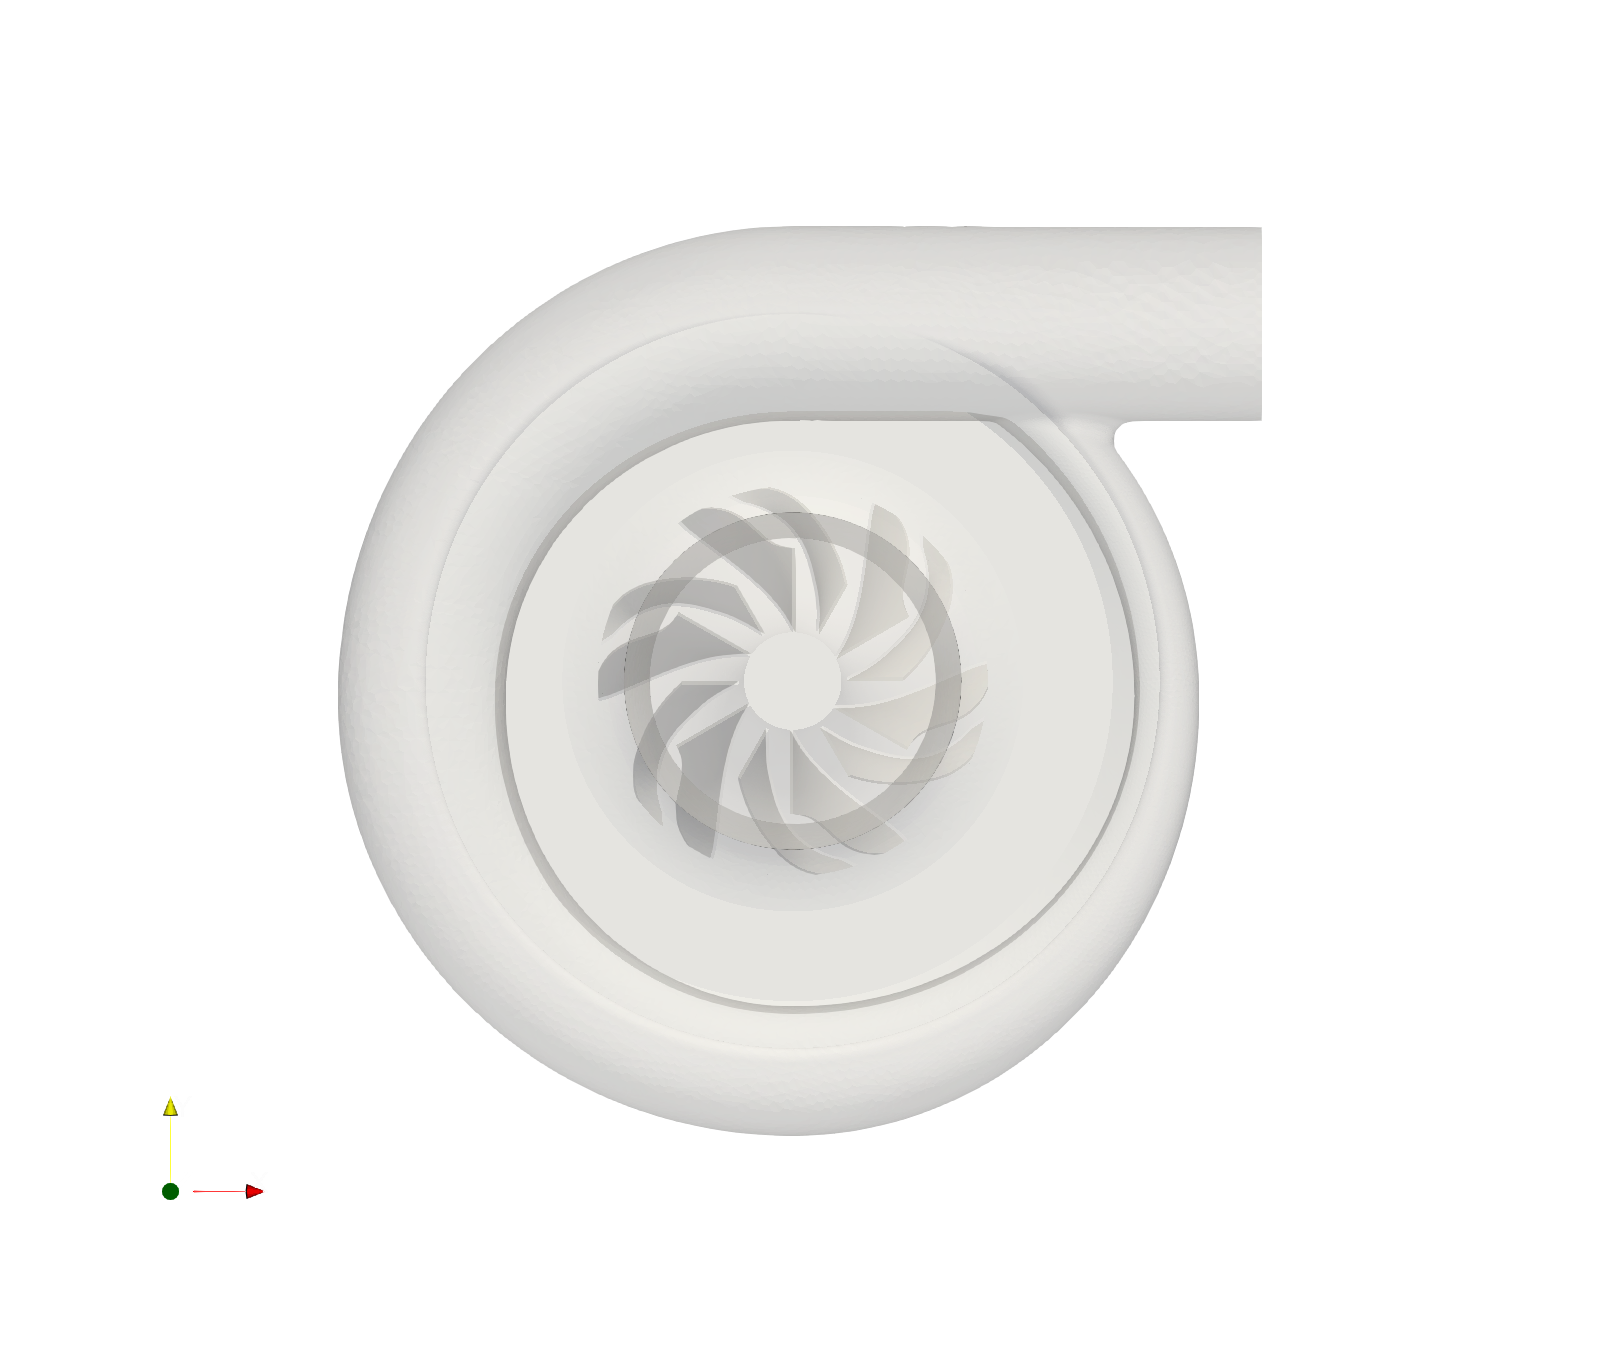
The 3D CAD model of the turbocharger used for the CFD analysis is shown below.
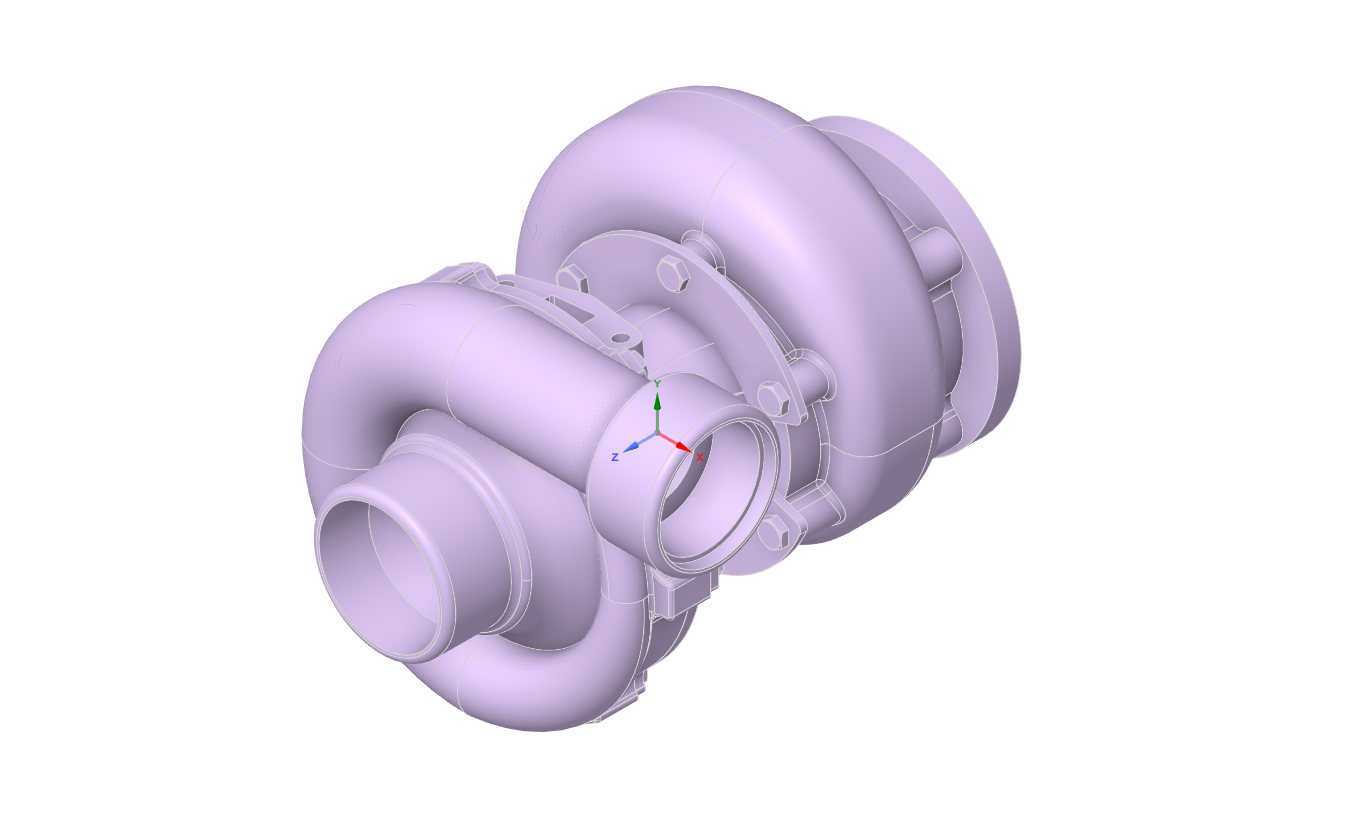

The compressor stage fluid domain was extracted and repaired by removing small faces, resolving split/duplicate edges, and closing gaps to ensure a watertight mesh can be generated in the next step.
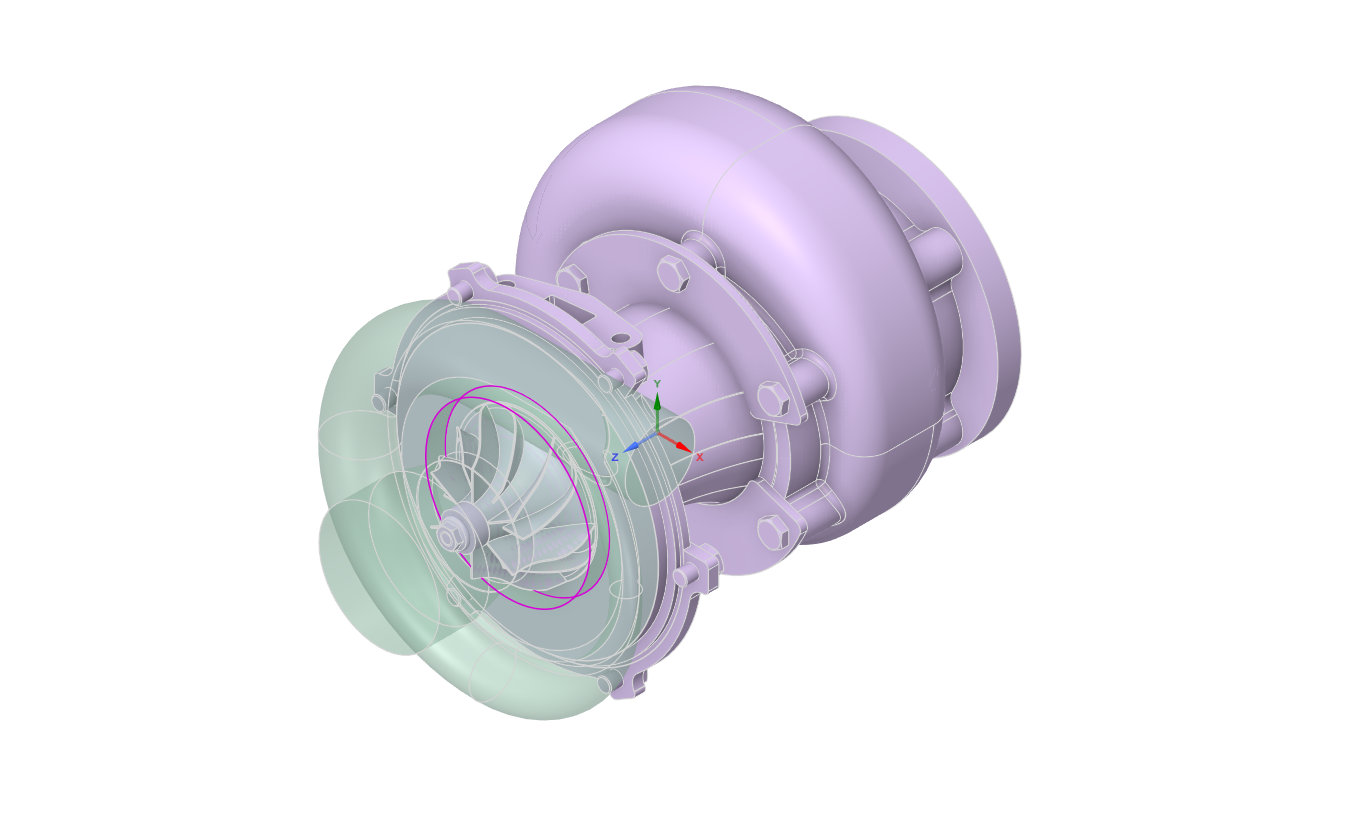
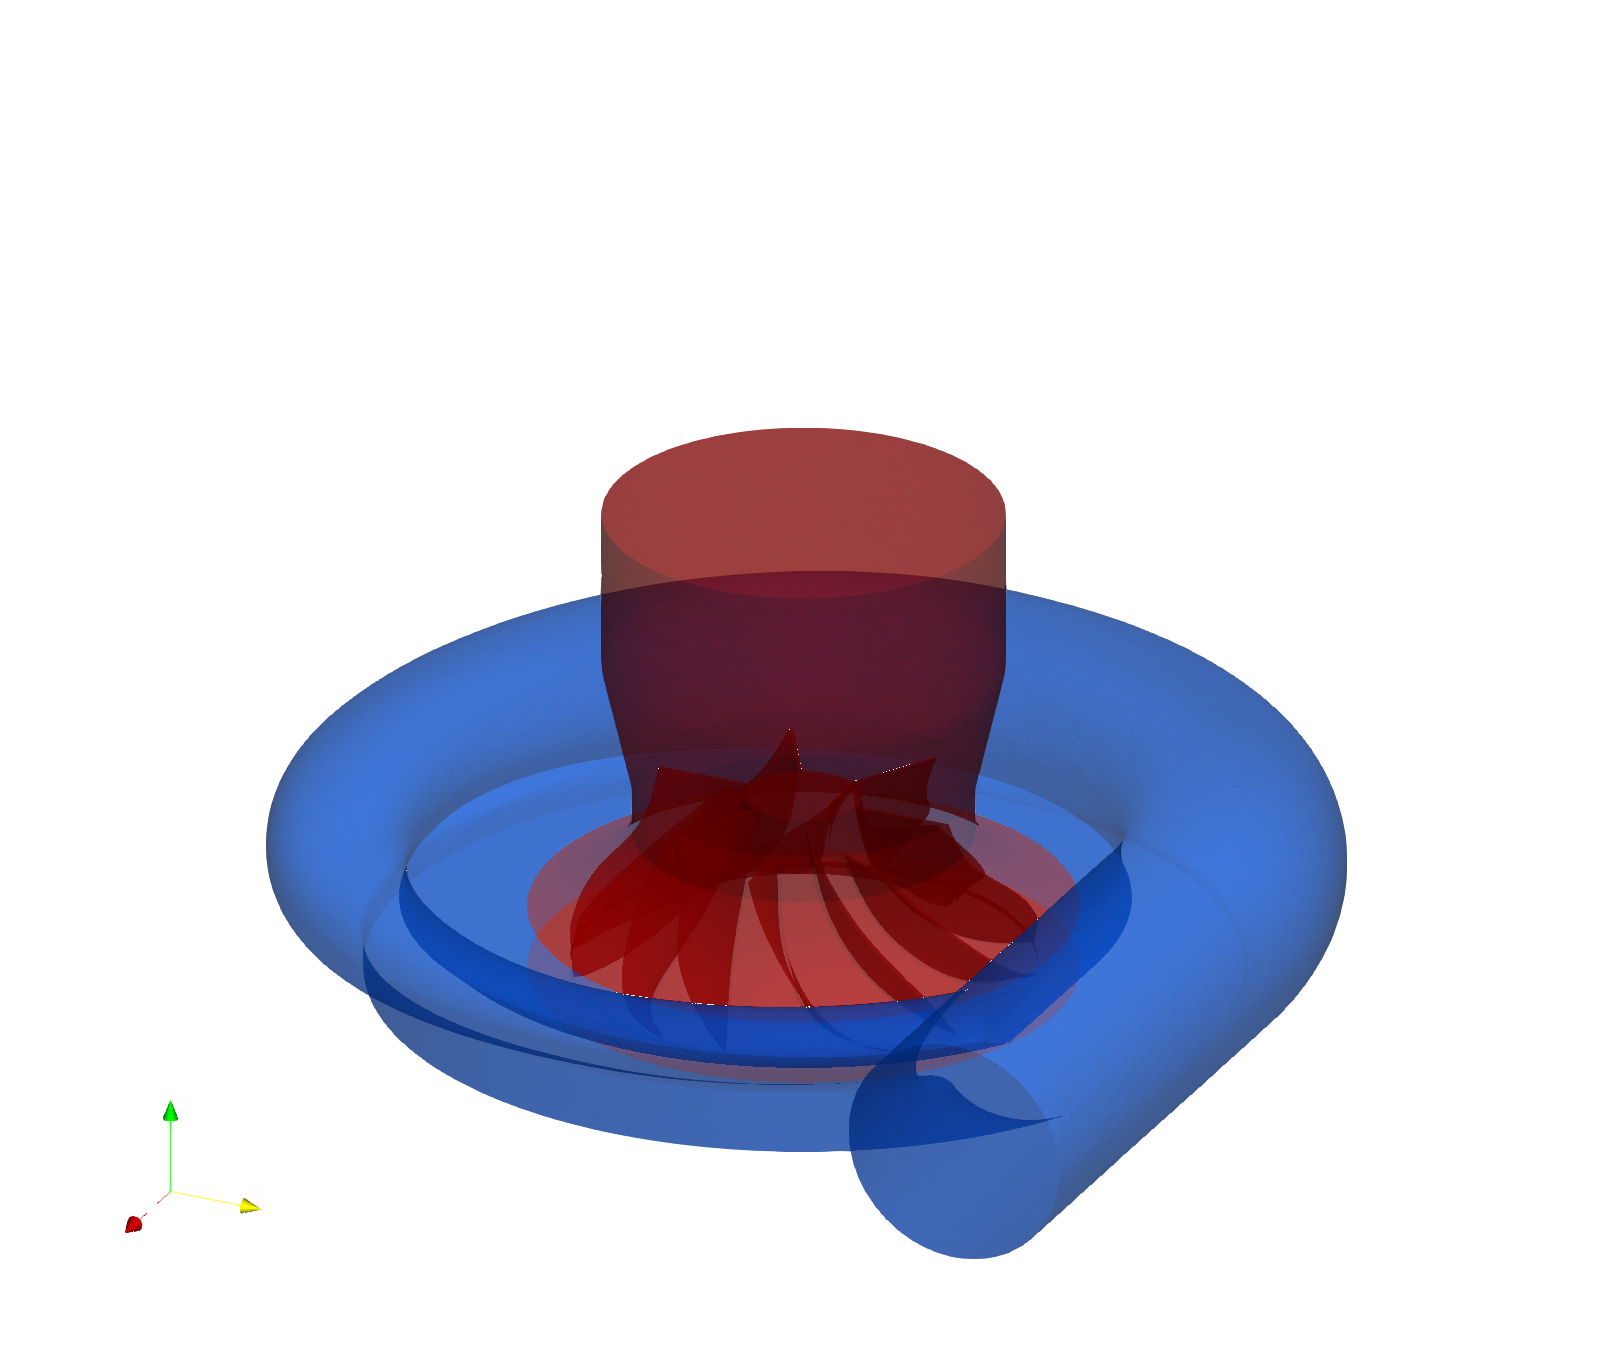
The fluid domain was split into two domain. The rotor (red) domain and the stator domain (blue).
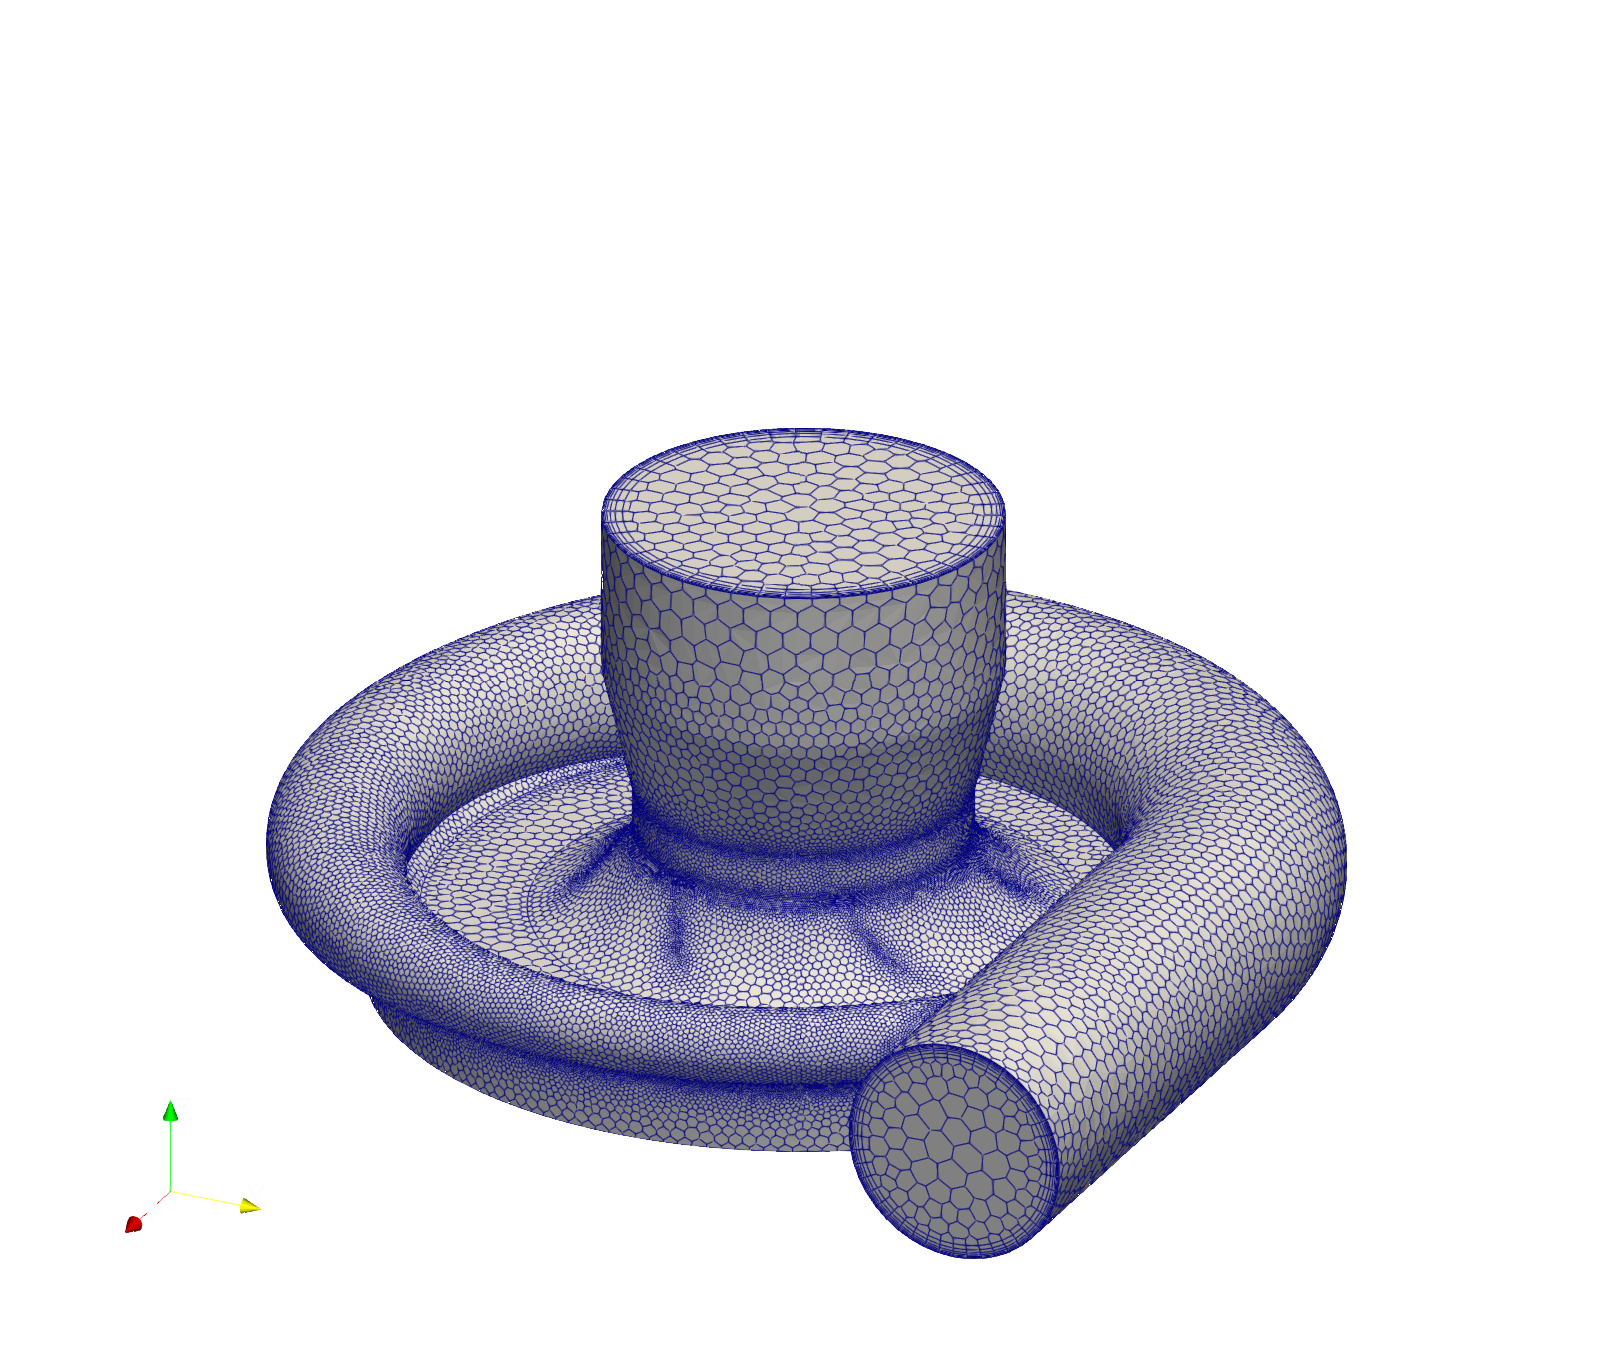
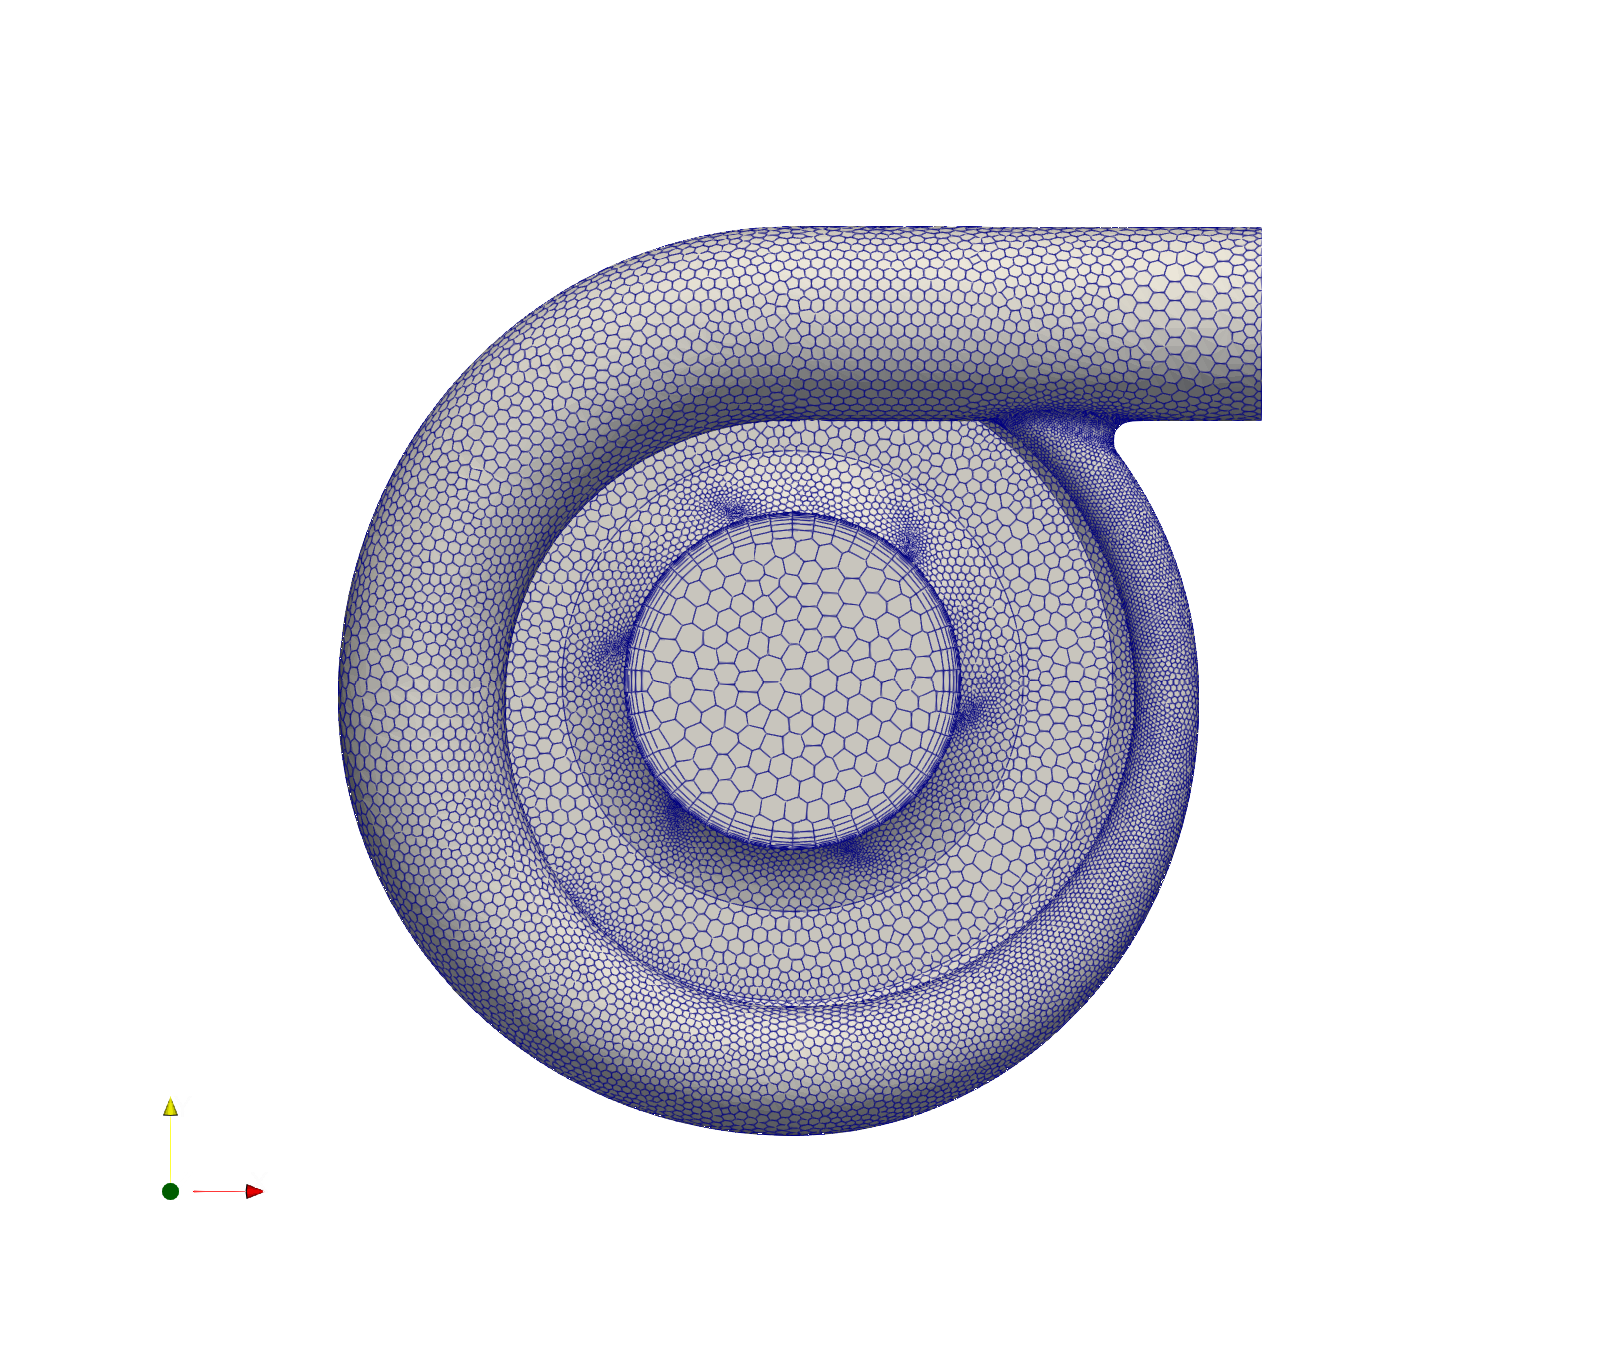
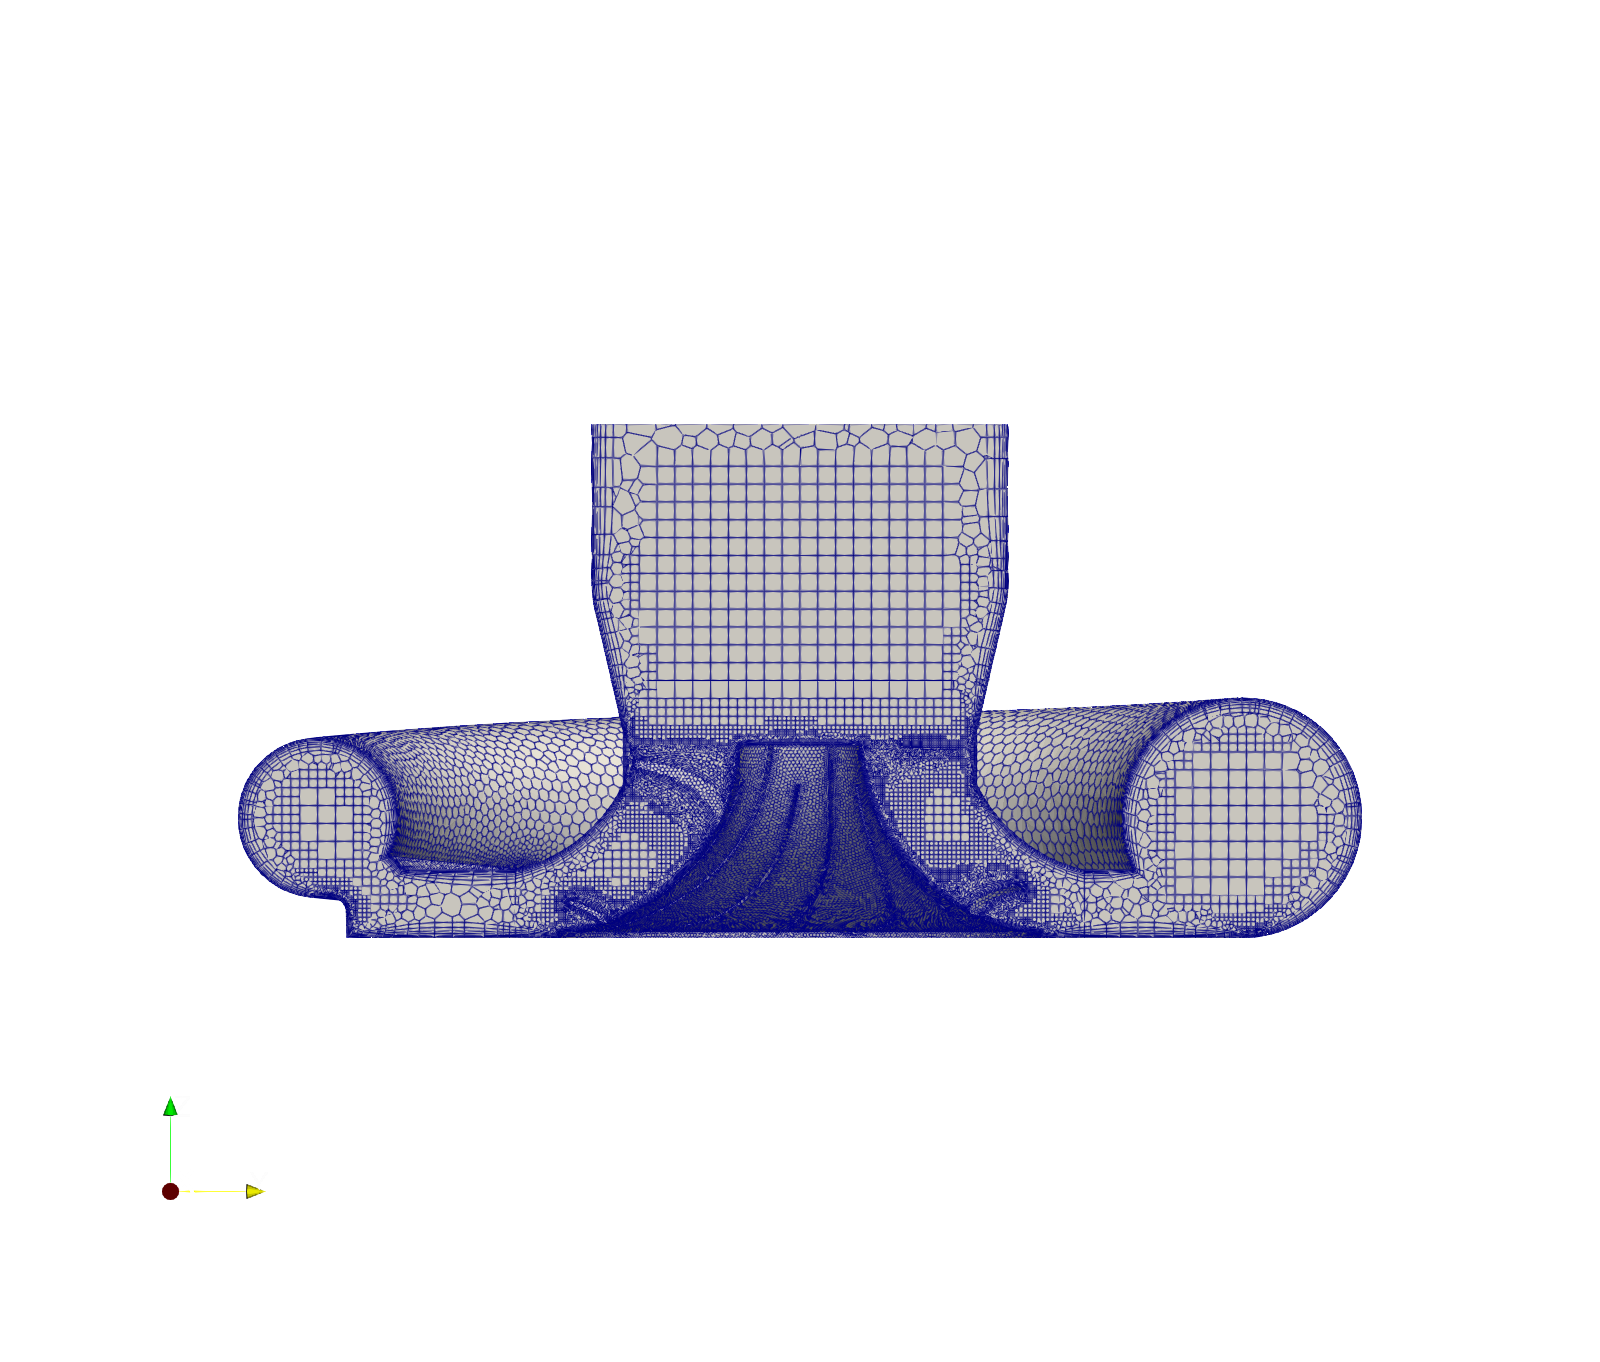
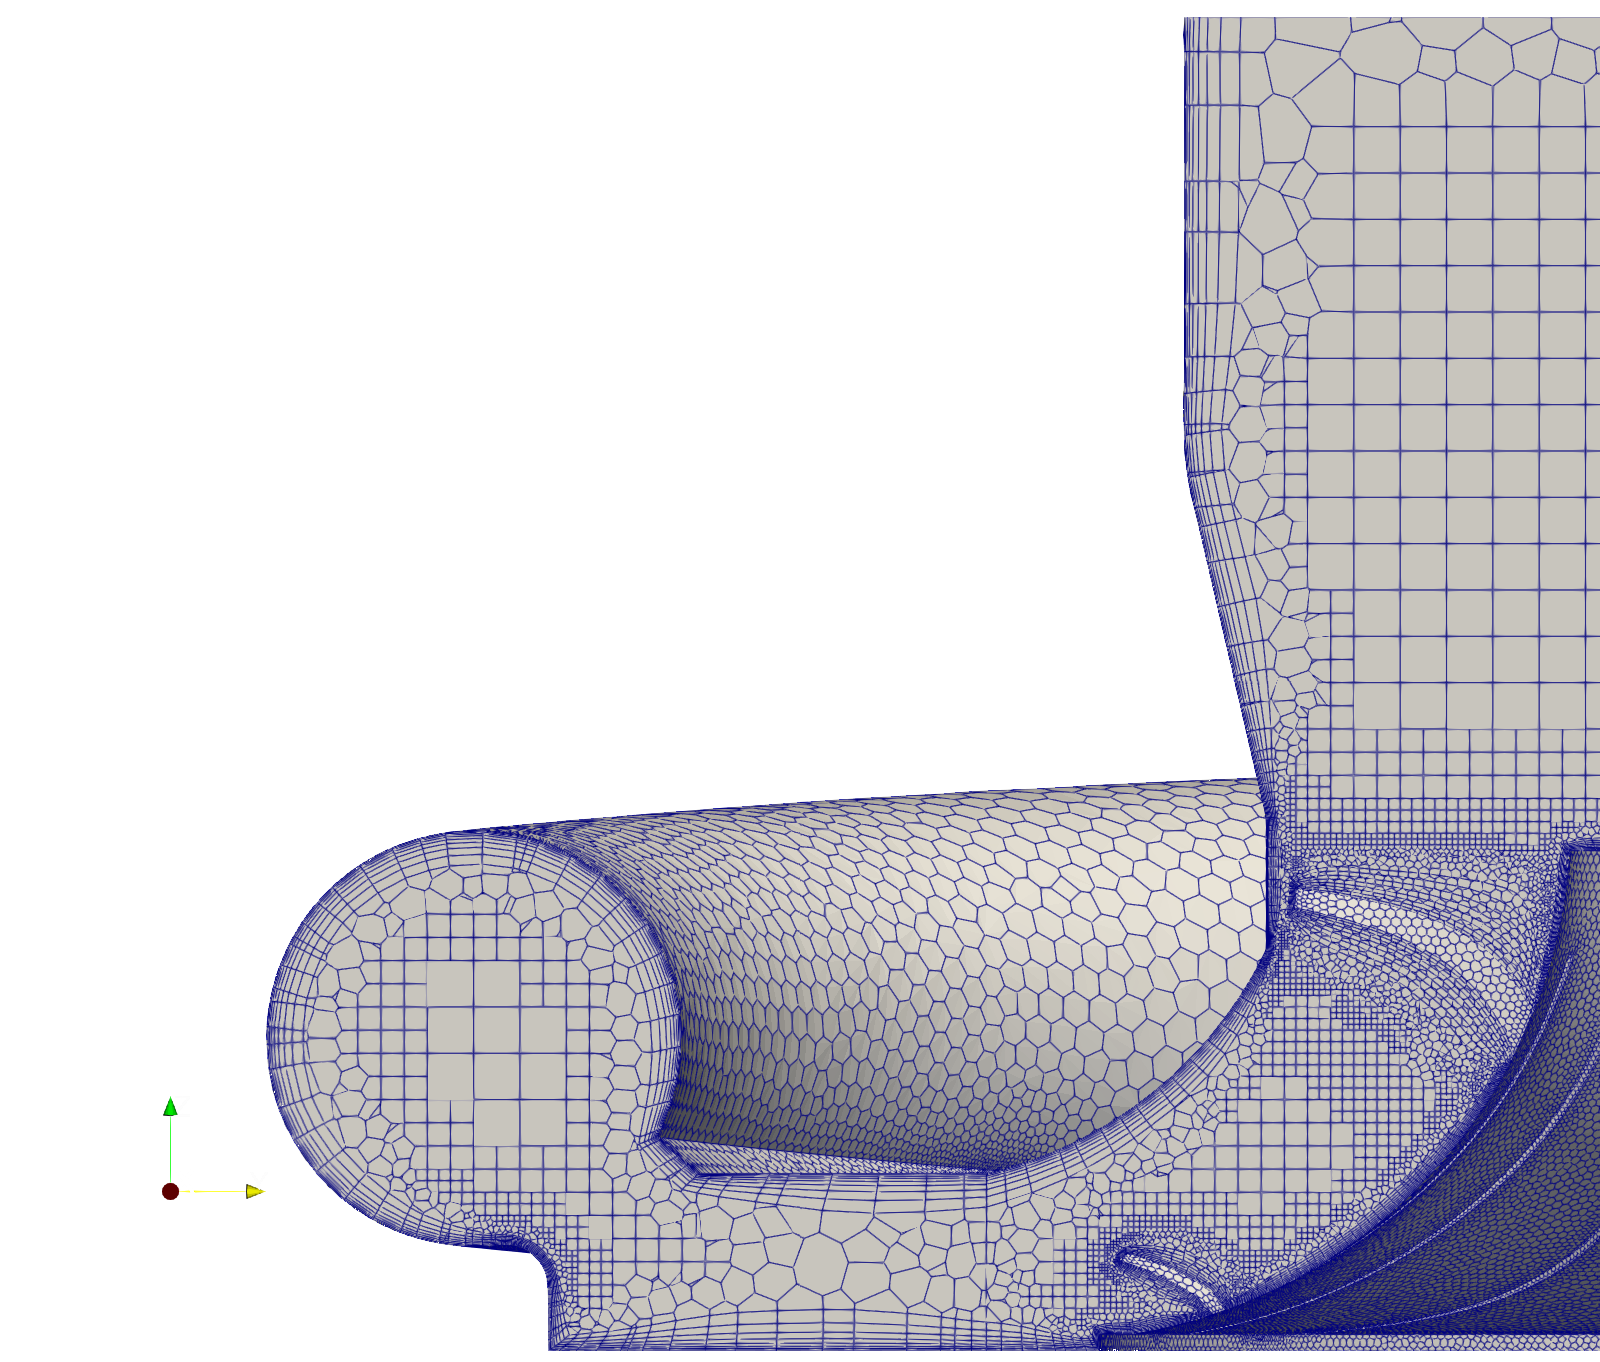
3. Mesh
The fluid domain was discretised using a hybrid mesh of 18 layers of hexahedral cells near solid boundaries and polyhedral cells in the core flow. This yielded an average y⁺ ≈ 35 in the MRF steady-state case, placing wall resolution in the logarithmic layer for use with wall functions in the chosen turbulence model. A conformal rotor–stator interface ensured accurate neighbour interpolation in the MRF setup, while the same mesh was applied in the sliding-mesh case with Non-Conformal Coupling (NCC) at the interface. The final mesh contained 5.5 × 10⁶ cells.
4. OpenFOAM setup
Four simulations were performed progressively with an increasing level of setup complexity.
| Sovler | A. SimpleFOAM + Frozen Blade | B. SimpleFOAM + MRF | C. PimpleFOAM + Frozen Blade | D. PimpleFOAM + Sliding Mesh |
|---|---|---|---|---|
| Turbulence Model | k-epsilon | k-omega SST | k-omega SST | k-omega SST |
| Rotor Rotational Speed [rpm] | 0 | 13,000 | 0 | 13,000 |
| Inlet BC | velocity inlet | mass flow inlet | mass flow inlet | mass flow inlet |
| Outlet BC | pressure outlet | pressure outlet | pressure outlet | pressure outlet |
| Blade BC | noSlip wall | MRFnoSlip wall | noSlip wall | movingWallVelocity |
| Housing BC | noSlip wall | noSlip wall | noSlip wall | noSlip wall |
| Rotor/Stator domain contact interface | - | - | - | movingWallSlipVelocity (with NCC) |
Residuals: A. SimpleFOAM Steady-State Frozen Blade

Residuals: B. SimpleFOAM Steady-State MRF Blade

Residuals: C. PimpleFOAM Transient Frozen Blade

Residuals: D. PimpleFOAM Transient AMI Rotating Blade

5. Results
Flow Visualisation
Below are the velocity contours of the MRF simulation (left) vs the sliding mesh simulation (right). While the MRF case shows a smoothed, time-averaged flow, the sliding mesh resolves unsteady blade-passing wakes and secondary flow structures, producing a more detailed velocity distribution at the rotor–stator interface.
Below are the pressure contours of the MRF simulation (left) vs the sliding mesh simulation (right). The sliding-mesh simulation reveals periodic fluctuations of pressure, which is developed by the frequency of the rotor rotation and its blade-passing harmonics.
Compression Ratio
The compression ratio of the turbocharger compressor stage is characterised by the ratio of outlet to inlet total pressures. The plot below indicates the pressure boost developing as simulation progresses. Due to limited computational resourses, it is apparent that the sliding mesh has yet to reach its steady state in comparison to the MRF simulation.

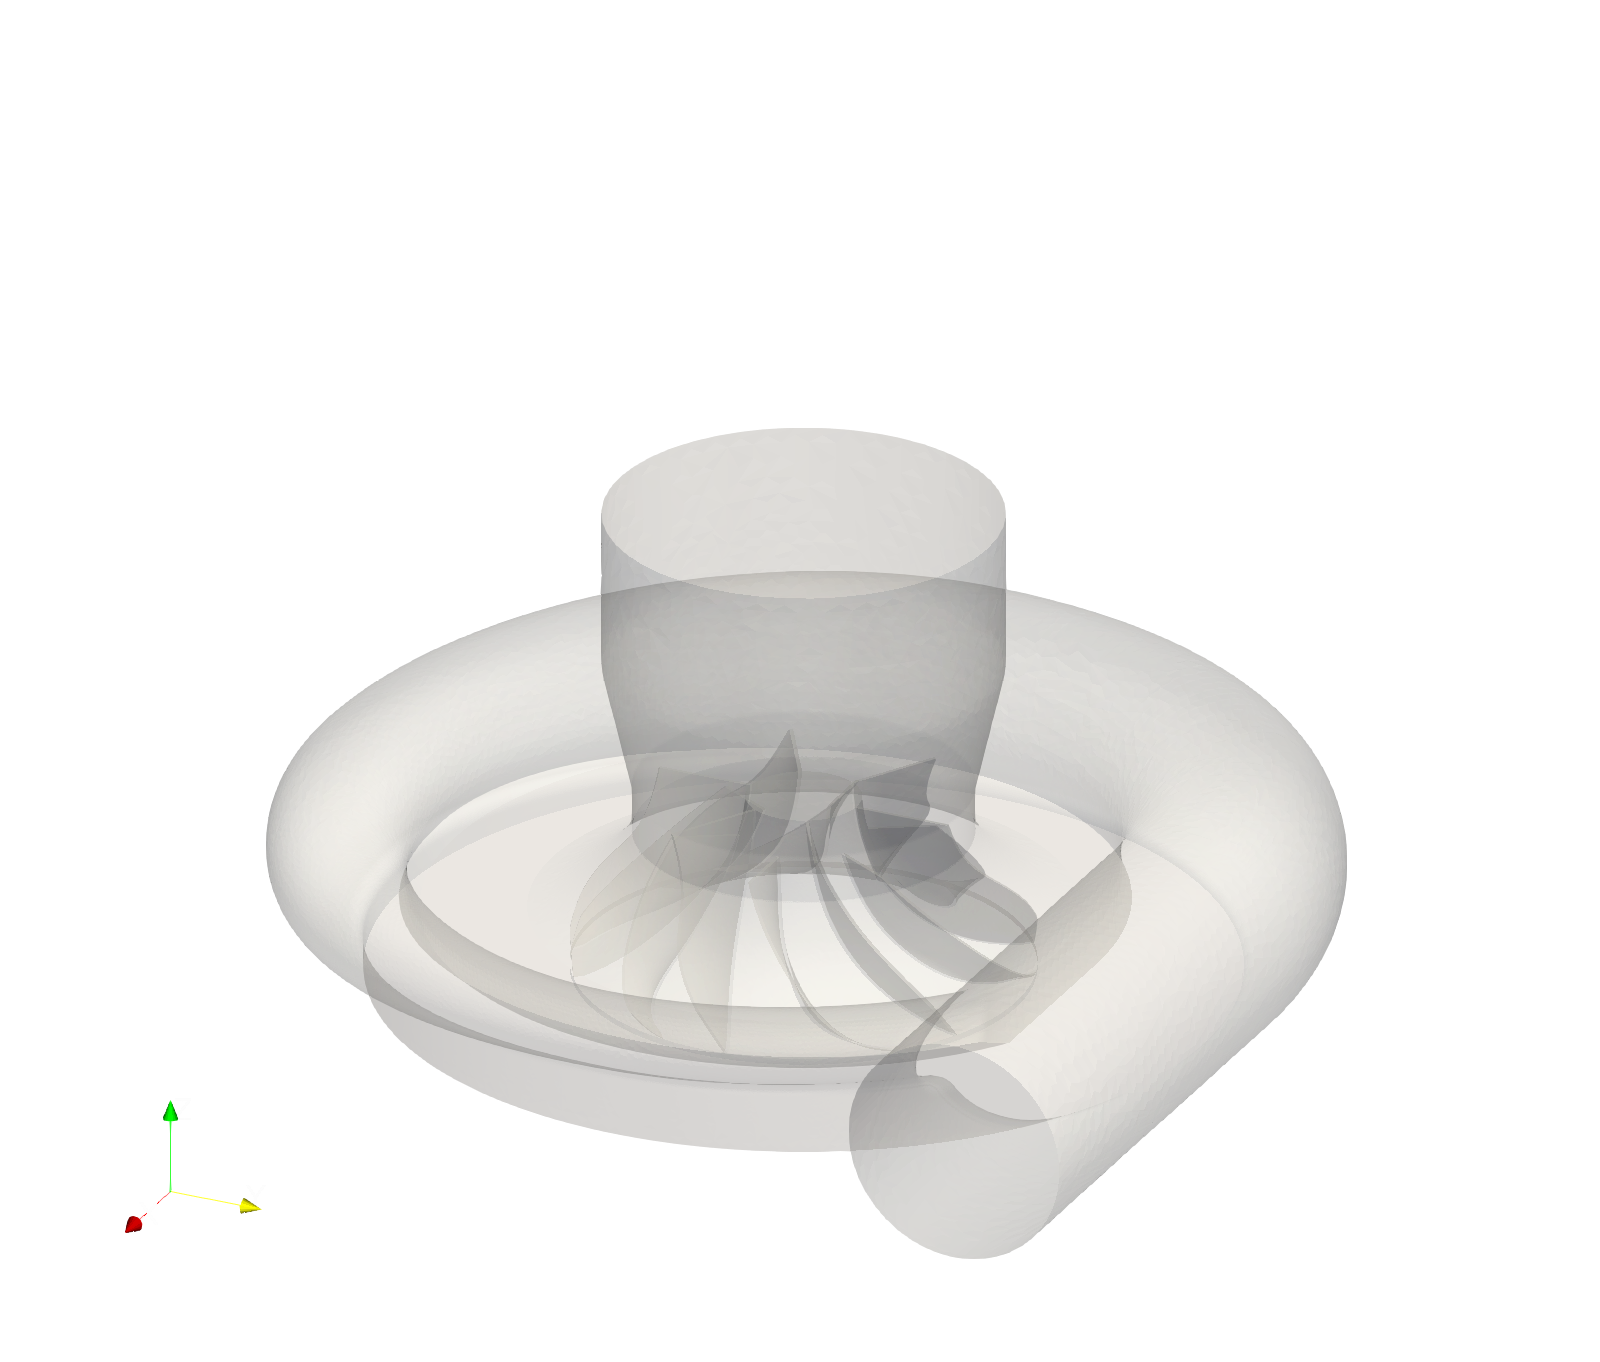
Q-criterion
The development of vortex structures from the sliding-mesh simulation using a Q-criterion iso-surface at 1×10⁸. This highlights the initiation of tip-leakage vortices and wake interactions downstream of the impeller.